

home
about
our services
our process
our team
our locations
INSIGHTS
client login
Case Studies
careers
get started
"This is a quote from a Coyle Leader. These can appear randomly from a few select quotes."

The current “AI Bull Market” just turned 4-years old on October 12th. “Happy Birthday!” sentiments are being heard across the land as the S&P 500 Index recently hit it’s 28th all-time high of the year. This is after the index achieved 39 all-time highs in 2025 and 57 in 2024.
Some investors, however, have serious concerns about how long we may be celebrating such good fortune in the future. They point to things like the small number of large companies that are driving returns (something we wrote about in July) and the lack of participation from a large majority of the remainder of the companies that comprise the headline indices.
Concentration and Breadth are two different characteristics often evaluated when assessing the underlying “health” of the market. Concentration measures how much of the market total value is represented by a small number of its largest companies and the dominance these top holdings have on index movements and returns.
Breadth measures the overall participation of all individual stocks represented in the Index. It evaluates whether the remaining market constituents that lie in the shadows of the Large Cap giants are improving or deteriorating and measures their contribution to the overall market return. Let’s look at each concept in more detail.
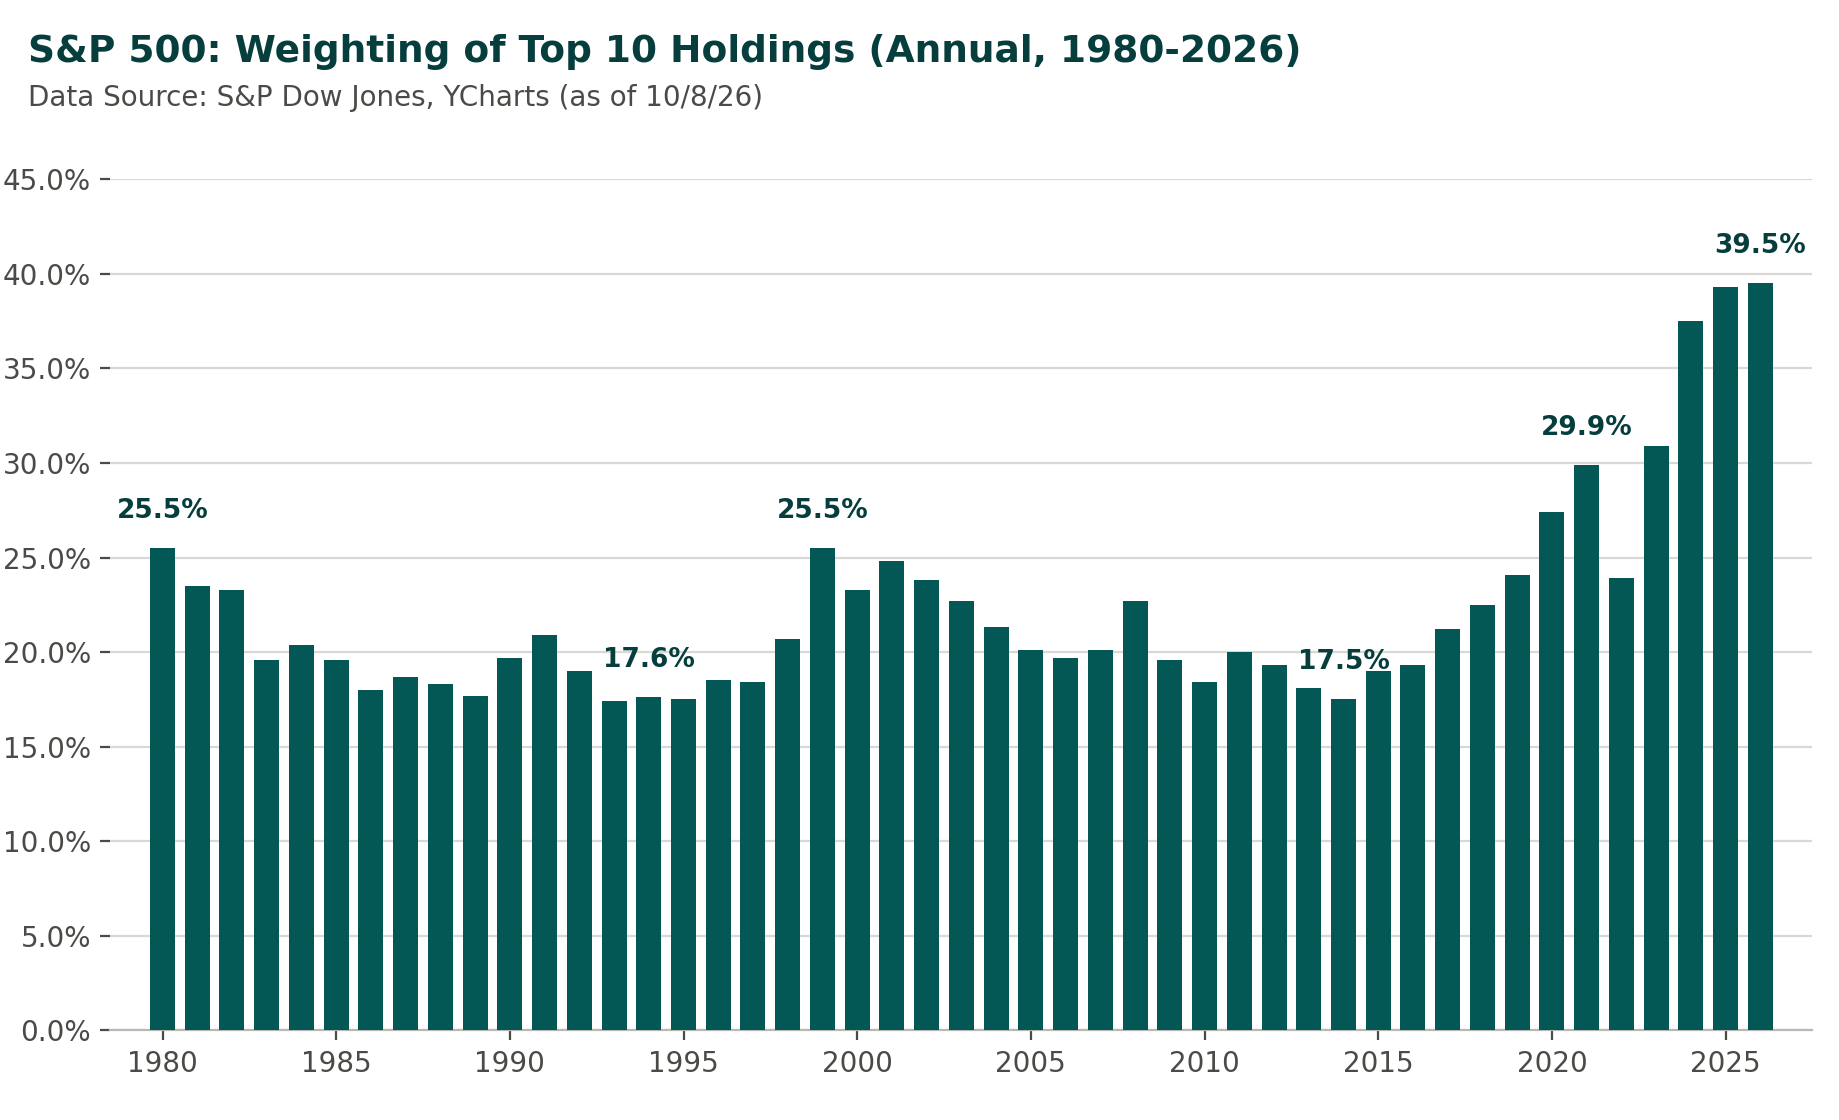
A common measure of market concentration is the percentage weight of the ten largest holdings in a stock market index. For example, the top ten holdings in the S&P 500 Index currently represent close to 40% of the total value of the Index [1]. For some perspective, previous levels since 1980 have ranged between 17% and 25%, as shown below, but more recently it has been increasing [2].
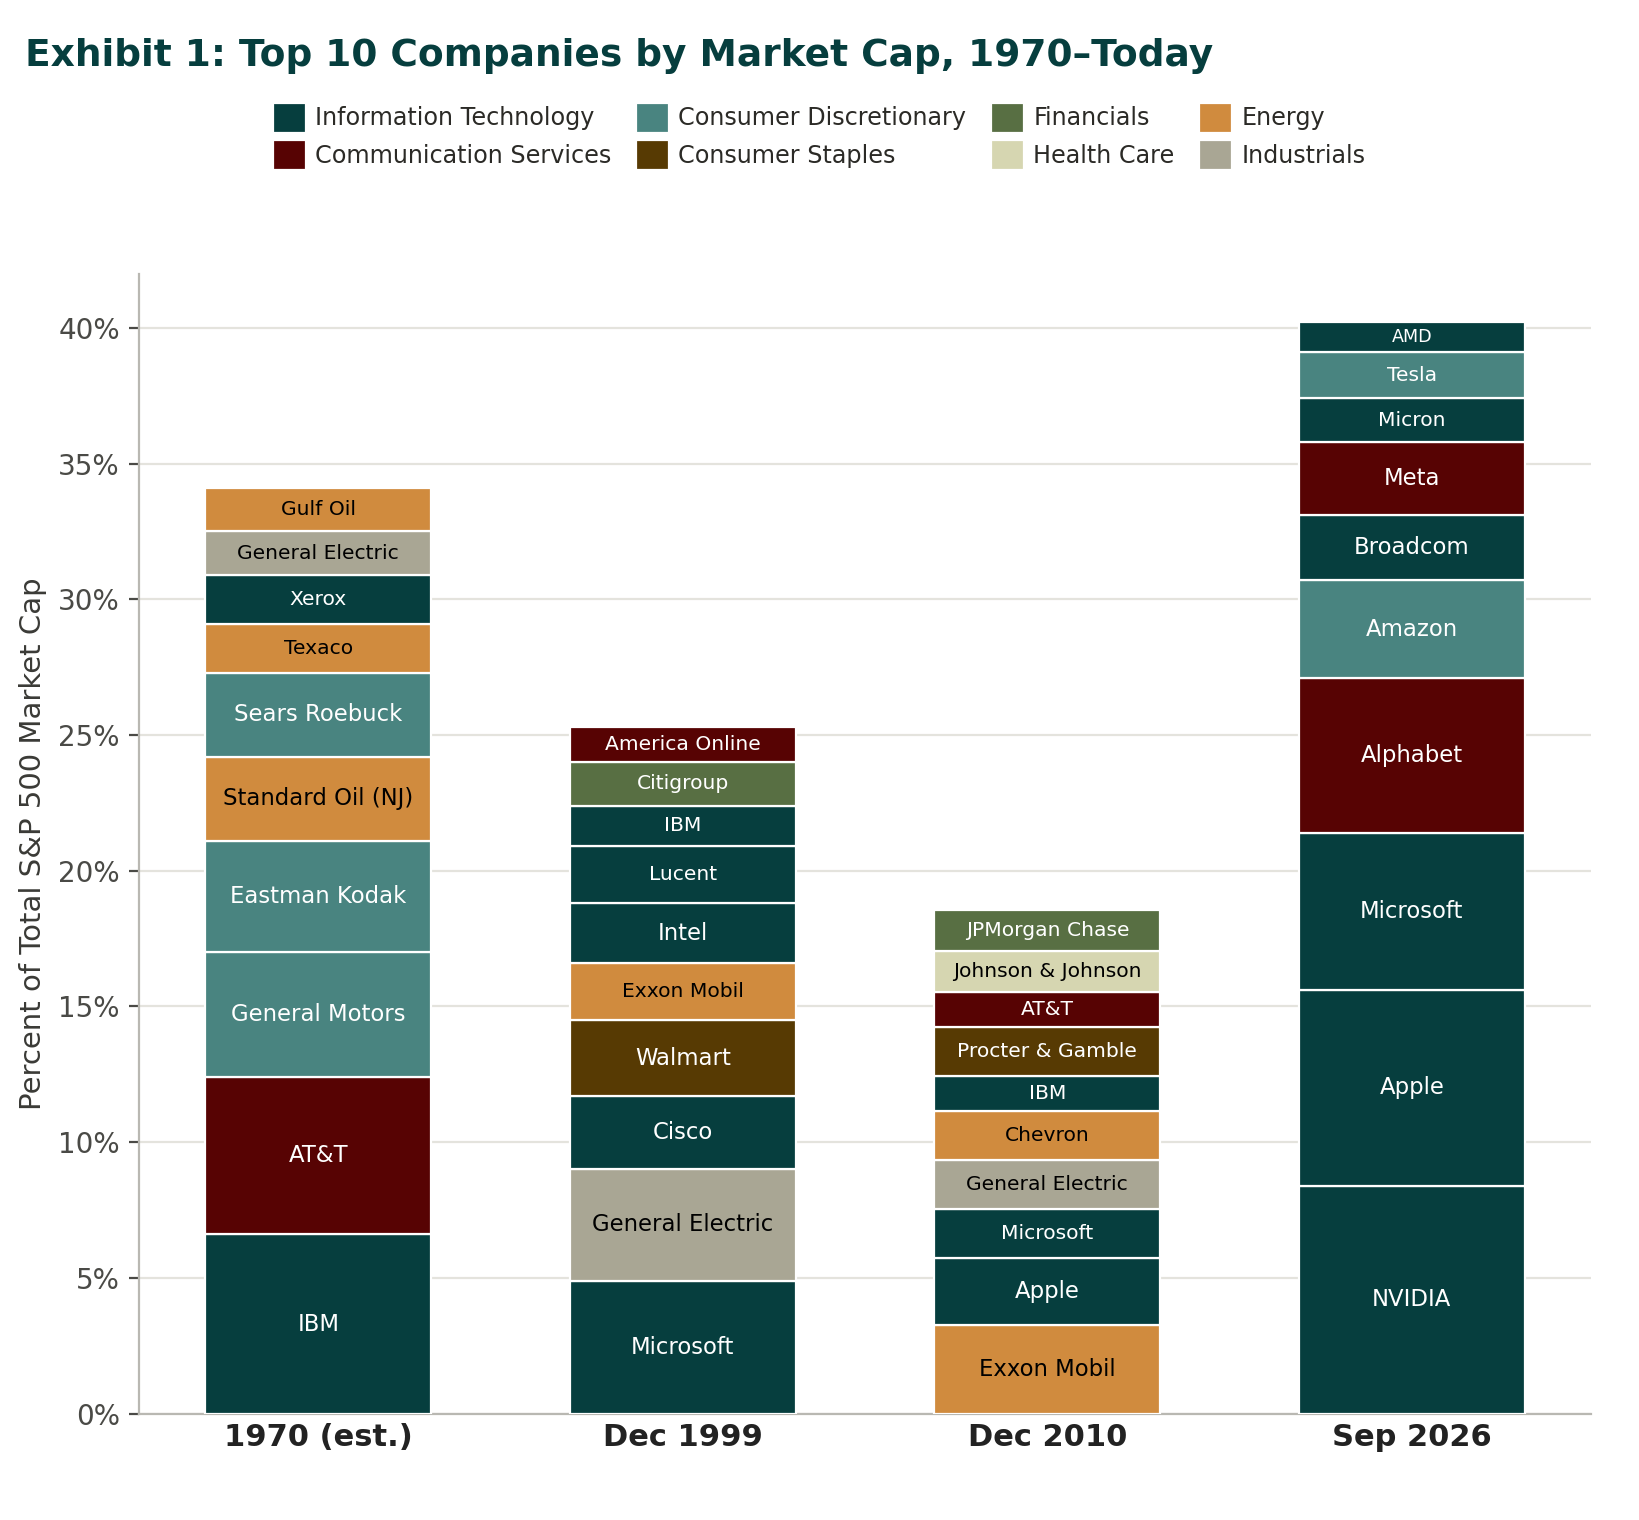
The concern now is not just the level of dominance, but also the makeup of those top ten companies. This is illustrated by the following chart which compares year-end 1970, 1999 and 2010 top ten components by sector to today, as explained in a recent market commentary by Pzena Investment Management:
The market breadth concept basically asks the question: How is the rest of the market, besides its ten largest components, contributing to overall market performance? To help answer this, let’s look at the Russell 3000 Index, which encompasses over 98% of publicly traded US companies (as represented by the iShares ETF (IWV)).
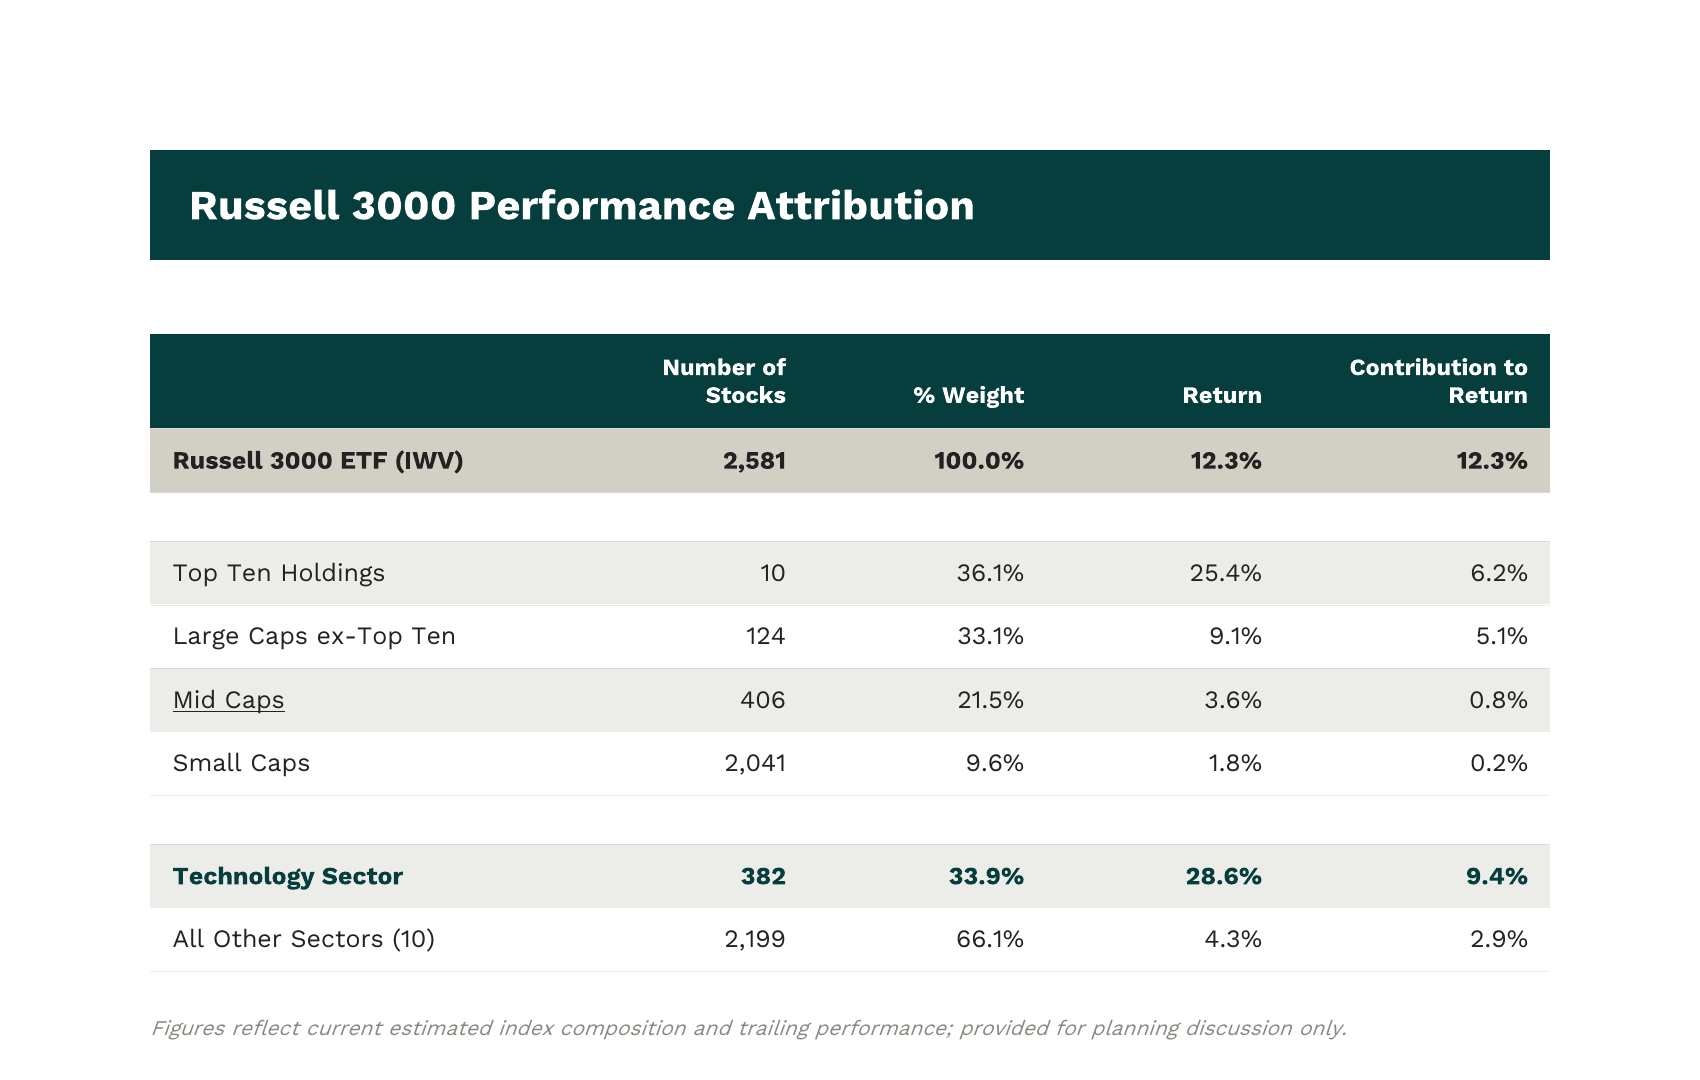
As shown below, for the first nine months of the year, the index returned a little over 12%, of which about half of that return was accounted for by those mega-cap Top Ten stocks [4]. The remaining large cap stocks contributed another 5%, while Small- and Mid-Cap stocks (SMID) chipped in another 1%. Looking at performance by sector, notice that the 382 tech companies (34% of the Index value) alone contributed over three-quarters of the total index return, while all the other sectors combined (2,199 companies and 66% of the value) produced the remaining 25%.
Another way to “slice and dice” the market breadth question is to see how many stocks failed to show a positive return. While only one Top Ten stock had a negative return YTD (Tesla was down 21%), 42% of the remaining stocks in the index lost money, with over 400 losing 25% or more of their value over the nine months since the first of the year.
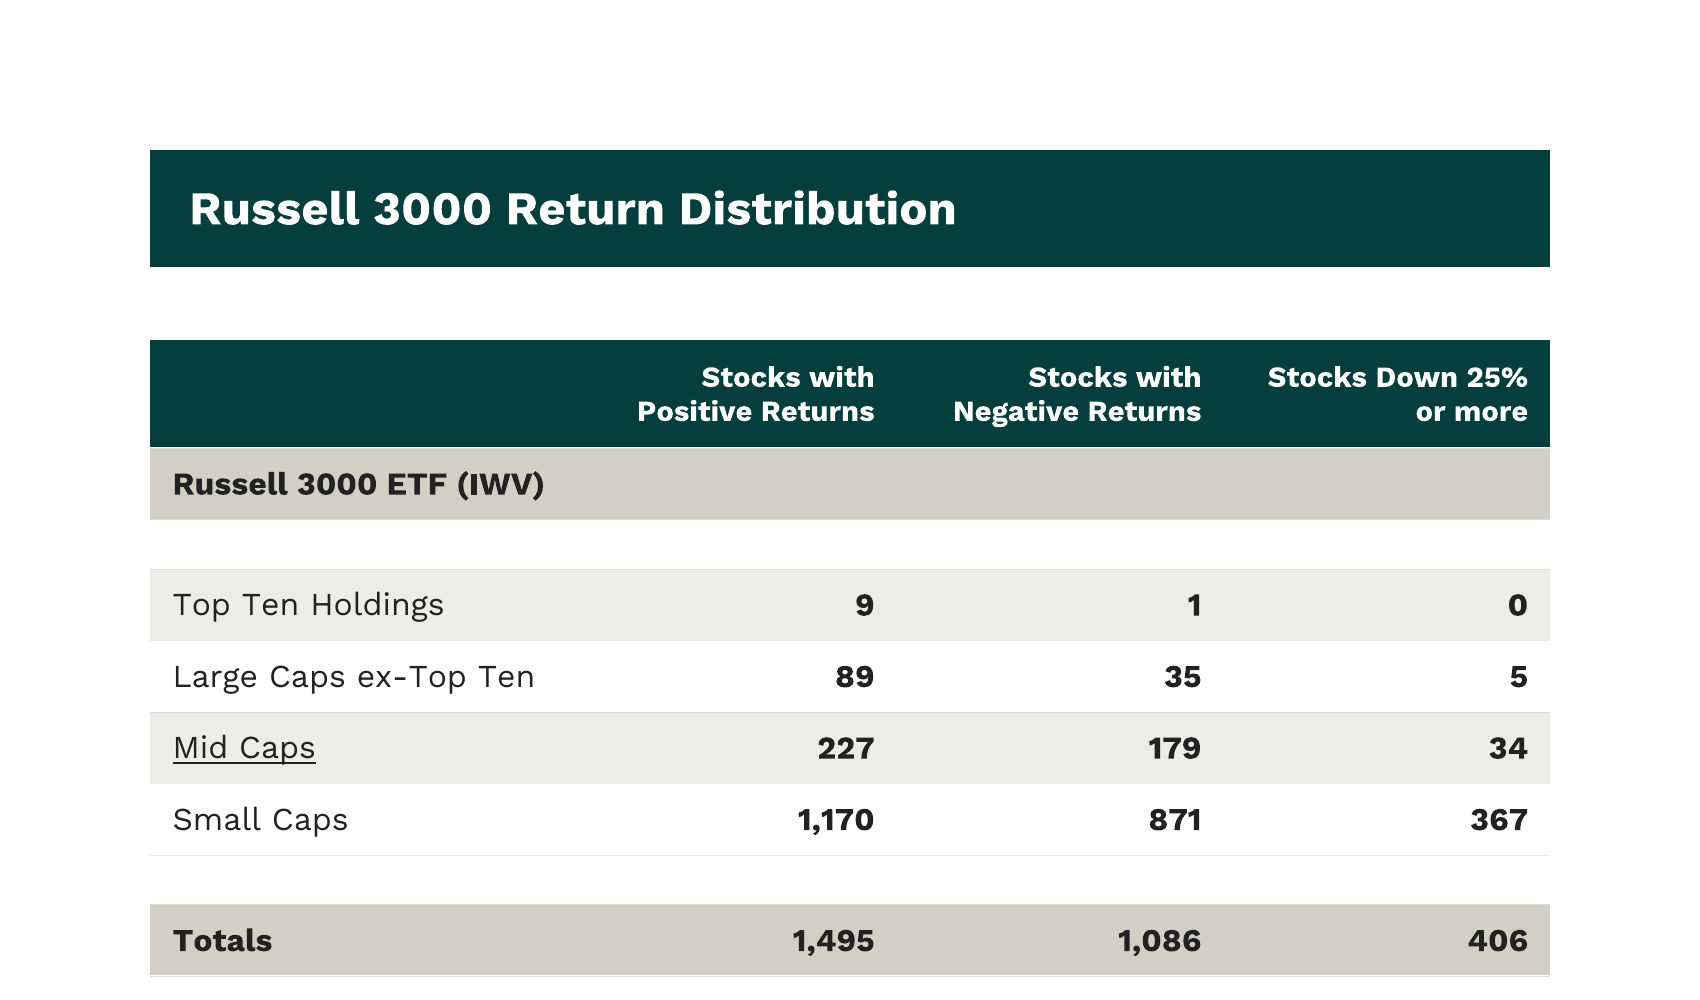
Looking at market breadth in this manner tells us that we have large-cap stocks driving almost 92% of the market’s performance so far this year. By contrast, SMID stocks, which represent almost 30% of the value of the Russell 3000 Index, contributed only 8% of its return. Furthermore, over one thousand (43%) of those SMID stocks had negative returns.
On a positive note, one other market breadth measure to consider is more forward-looking. Here, we examine what percentage of publicly traded companies (represented by the S&P 500 Index) have positive 12-month forward revenues and earnings estimates [5]. This chart shows that those estimates have risen significantly during this bull market, improving from about 50% to now 85% of S&P 500 companies. If these estimates hold, the “Fabulous Earnings Momentum” (FEMO) we have seen in those AI-related companies may spread to a wider swath of the market which could lead to improving breadth [6].
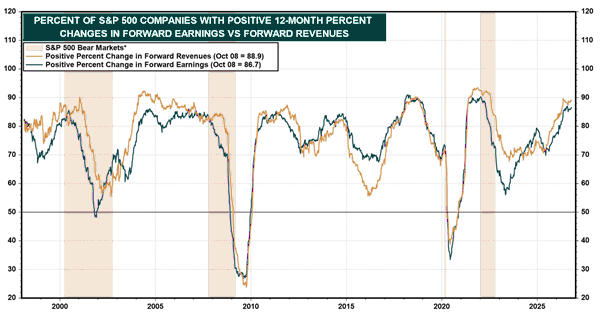
In summary, today we are looking at a market characterized by an unusually high level of concentration and relatively low market breadth. At the same time, many of these mega companies have demonstrated strong revenue and earnings growth and as discussed above, this earnings growth is expected to continue and spread to the broader market. This has led to lower Current and Forward P/E ratios which could be viewed as another positive indicator going forward.
Our investment philosophy at Coyle Financial underscores the idea that equity investing (and its associated risks) is essential to helping our clients achieve their long-term financial goals. Diversification across sectors, industries and geography, including those participating and not participating in the current market momentum, can help mitigate (but not eliminate) those risks over full market cycles.
A disciplined, diversified investment strategy, aligned with your financial goals and time horizon, remains more important than trying to anticipate the market's next move. As always, if market developments raise questions about your investments or financial plan, we welcome the conversation between our regularly scheduled meetings.
1) The Top Ten are: NVIDIA, Apple, Microsoft, Amazon, Alphabet, Broadcom, Meta, Micron Technology, Tesla and Advanced Micro Devices.
2) https://bilello.blog/2026/the-state-of-the-markets-october-2026?utm_source=charlies-newsletter-88171d.beehiiv.com&utm_medium=newsletter&utm_campaign=the-state-of-the-markets-october-2026&_bhlid=89f701dfeab69920a5f55ae1ae53c4ed9bb75d42
3) https://seekingalpha.com/article/4955246-pzena-investment-management-q3-2026-letter
4) Analysis by Coyle Financial Counsel, LLC, using Morningstar Direct
5) Earnings are simply the profits a company generates after paying its expenses.Over time, growth in those profits is one of the fundamental drivers of stockprices.
6) https://www.yardeniquicktakes.com/is-femo-too-concentrated/?ref=yardeni-quicktakes-newsletter
All information is from sources deemed reliable, but no warranty is made to its accuracy or completeness. This material is being provided for informational or educational purposes only, and does not take into account the investment objectives or financial situation of any client or prospective client. The information is not intended as investment advice, and is not a recommendation to buy, sell, or invest in any particular investment or market segment. Those seeking information regarding their particular investment needs should contact a financial professional. Coyle, our employees, or our clients, may or may not be invested in any individual securities or market segments discussed in this material. The opinions expressed were current as of the date of posting but are subject to change without notice due to market, political, or economic conditions. All investments involve risk, including loss of principal. Past performance is not a guarantee of future results.
Copyright © 2023 Coyle Financial Counsel. All rights reserved.
Start the conversation today by reaching out to our team.