

home
about
our services
our process
our team
our locations
INSIGHTS
client login
Case Studies
careers
get started
"This is a quote from a Coyle Leader. These can appear randomly from a few select quotes."

With apologies to Shakespeare, we ask the question: What are Macbeth’s witches trying to tell us about the stock market? Are they warning us of bubble trouble on the horizon?
We are now entering the fourth year of the A.I. Bull Market, which started with the introduction of ChatGPT in November of 2022. Some market commentators are beginning to compare this to the Dotcom Bubble of the late 1990s. While investment bubbles are notoriously difficult to predict, we offer some observations and thoughts on the current U.S. market.
If, for some of you, this bull market feels suspiciously like the one that started in the mid-1990s around the internet craze, you have a good reason to feel that way (and a good memory). This chart shows the tech-heavy NASDAQ Composite Index for that period (blue line) with the current bull market superimposed over it (red line) [1]:
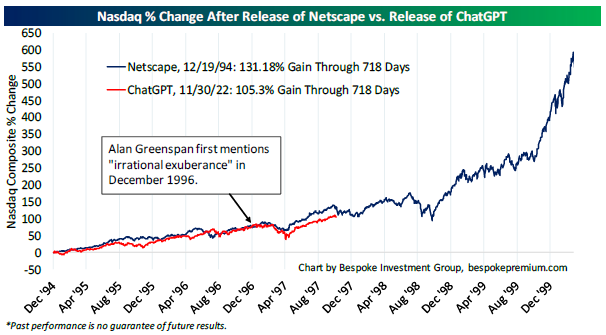
The current NASDAQ is tracing a similar performance line after 718 days as it did during the Dotcom Bubble, up 105% versus 131%. The index increased fivefold over this period. The prices of thirteen large-cap stocks increased over 1,000%, and Yahoo!’s IPO price jumped from $13 to $33 per share in one day [2]
Will history repeat itself? Long-time readers of the Market Observer know very well by now that “predicting the future” is not one of our core competencies. While we don’t claim to have market-bubble omniscience, there are a number of things that suggest that this bull market (so far) is not a repeat of the Dotcom Bubble.
Valuations
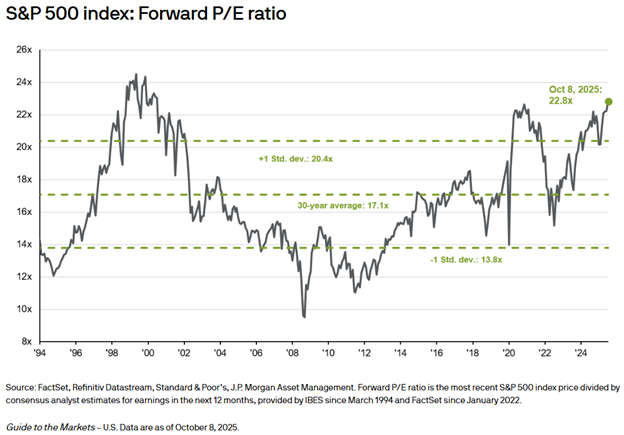
There’s little doubt that today’s U.S. stock market valuations are stretched to say the least, with the forward price-to-earnings ratio for the S&P 500 Index at 23 times (the 30-year average is 17 times)
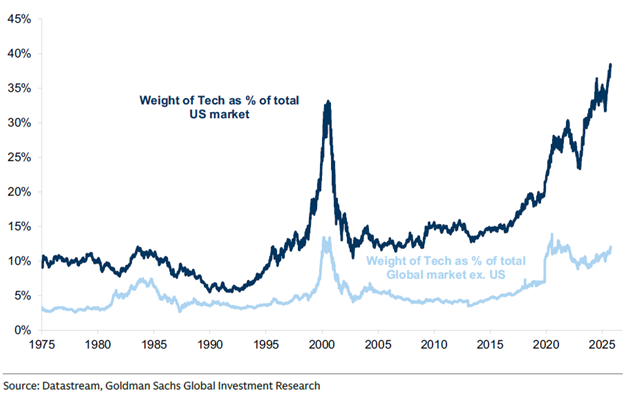
Of course, the technology sector today is driving the lion’s share of the overall jump in valuation, just as it did during the Dotcom Bubble, resulting in ever-increasing market dominance. You can compare the percentage weight of the tech sector versus the whole U.S. market in this chart (now pushing 40% versus almost 35% then):
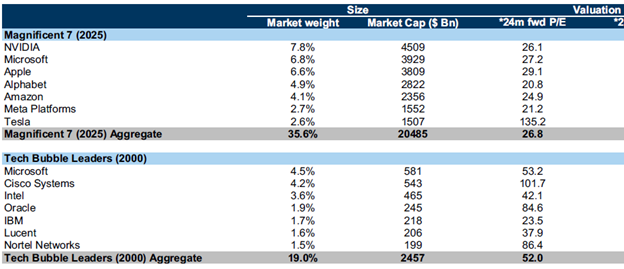
But compared to the tech leaders in 2000, today’s dominant companies (represented by the “Magnificent 7”) are half as expensive in terms of the 24-month forward price-to-earnings metric — averaging 26 times (without Tesla) versus 52 times for the top seven companies 25 years ago [4]:
Profitability
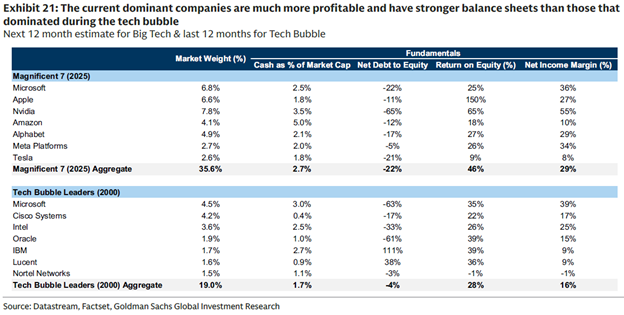
A recent note by Meera Pandit of J.P. Morgan Asset Management stated: “Last year, S&P 500 profits grew 10%, and the past three quarters have boasted double-digit profit gains. Tech has been a standout, with the Mag 7 set to contribute 44% of profit growth this year. Margins remain near record levels at 13.6%.” [5]
The Mag 7 companies today are in far better financial shape than the comparable tech leaders in the Dotcom Bubble period, as shown below. Notice that average return on equity and net-income margins are significantly stronger for the Mag 7 companies [6]:
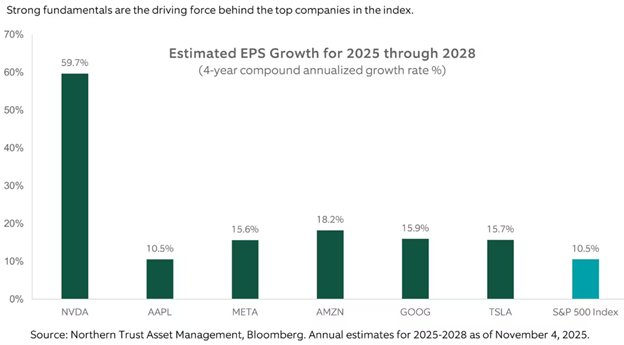
These strong fundamentals are expected to continue. One estimate has the 4-year compound annualized earnings per share growth rate for the S&P 500 Index at 10.5%, with estimates for the top tech companies, as shown below [7]:
Capital Expenditures
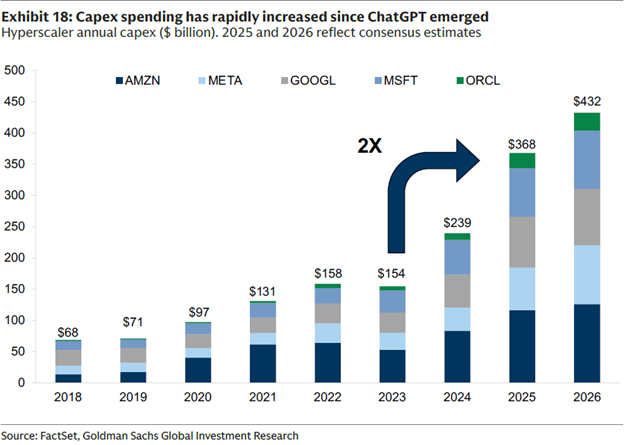
Another important point of comparison between these two bull markets involves the massive corporate CapEx expenditures made to underpin the growth in the two emergent technologies, the internet and artificial intelligence. Here are the CapEx spending histories for five of today’s dominant tech companies since the emergence of ChatGPT [8]:
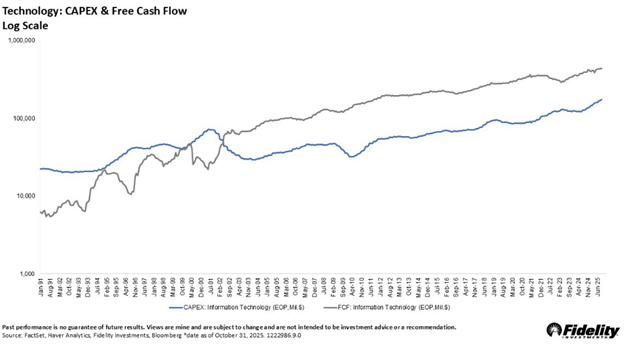
A recent note from Denise Chisolm of Fidelity Investments stated: “Before the [Dotcom] bubble burst, tech firms spent more than they earned for nearly a decade — an entire cycle of outspending free cash flow. Today, it’s the reverse. For 20 years, the sector has generated cash faster than it has invested it. That doesn’t guarantee every AI dollar will earn its keep, but it does mean the industry is funding growth from a position of strength, not speculation.” [9]
Notice in her accompanying chart that CapEx spending in the technology sector exceeded free cash flow from 1991 to 2001:
It’s anyone’s guess as to whether these massive A.I. investments will ultimately pay off. Such is the nature of disruptive technological changes.
Final Thoughts
We have attempted to highlight some key differences between today’s A.I. Bull Market and the Dotcom Bubble of 25 years ago. There is much more to the A.I. story — and the question it raises about the duration of the current bull market — than we can cover in a short commentary.
We leave you with some final thoughts (and one more chart) to ponder:

In closing, it is always prudent to expect volatility — as we’ve seen recently in risky long-term assets like stocks, dependent as they are on the future profits of companies well into the future. Even in a bull market, drawdowns of 10% to 15% are normal (remember April of this year?).
Our response to Macbeth’s witches is to focus on our core belief in the importance of asset allocation when structuring investment portfolios. The appropriate mix of liquid and balanced allocations provides investors with the confidence to maintain growth allocations through full market cycles.
When the “bubble trouble” chatter starts to get too loud, investors should step back and review their structure. Fears that begin to arise can often be tempered through slight adjustments as opposed to more drastic reactions that can derail progress toward long-term objectives.
[1] Bespoke Investment Group Wealth Management Report,October 2025
[2] Bespoke Investment Group Wealth Management Report,October 2025
[4] Goldman Sachs Portfolio Research, “Why we are not in abubble…yet”, October 8, 2025
[5] https://am.jpmorgan.com/us/en/asset-management/adv/insights/market-insights/market-updates/on-the-minds-of-investors/are-stocks-too-expensive/(accessed 11/25/25)
[6]Goldman Sachs Portfolio Research, “Why we are not in a bubble…yet”, October 8,2025
[7] [10] https://ntam.northerntrust.com/united-states/all-investor/insights/point-of-view/2025/are-we-in-stock-market-bubble#article(accessed 11/25/25)
[8] GoldmanSachs Portfolio Research, “Why we are not in a bubble…yet”, October 8, 2025
[9]https://www.linkedin.com/pulse/tech-4-charts-make-you-think-denise-chisholm-vcshe/?trackingId=s7wlYSjWQrG1G3bDqHR5PA%3D%3D(accessed 11/25/25)
[11] https://www.bloomberg.com/news/articles/2025-11-25/alibaba-revenue-exceeds-estimates-driven-by-ai-and-cloud-growth?srnd=homepage-americas(accessed 11/25/25)
All information is from sources deemed reliable, but no warranty is made to its accuracy or completeness. This material is being provided for informational or educational purposes only, and does not take into account the investment objectives or financial situation of any client or prospective client. The information is not intended as investment advice, and is not a recommendation to buy, sell, or invest in any particular investment or market segment. Those seeking information regarding their particular investment needs should contact a financial professional. Coyle, our employees, or our clients, may or may not be invested in any individual securities or market segments discussed in this material. The opinions expressed were current as of the date of posting but are subject to change without notice due to market, political, or economic conditions. All investments involve risk, including loss of principal. Past performance is not a guarantee of future results.
Copyright © 2023 Coyle Financial Counsel. All rights reserved.
Start the conversation today by reaching out to our team.